Price-to-earnings Ratio (P/E)
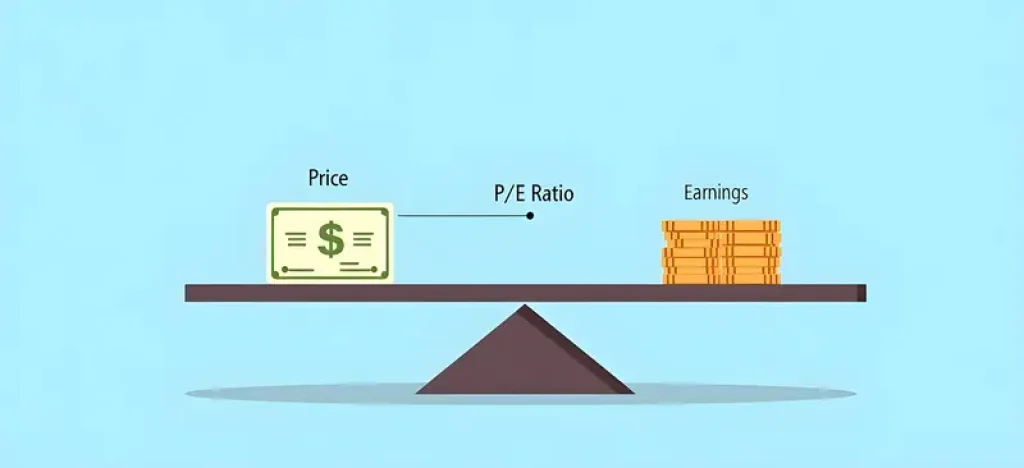
The Price-to-Earnings Ratio (P/E) is a financial metric used to evaluate the valuation of a company by comparing its current share price to its earnings per share (EPS). It is a widely used tool among investors to determine whether a stock is overvalued, undervalued, or fairly valued relative to its earnings. The P/E ratio is calculated by dividing the market price of a share by the earnings per share of the company. This ratio helps investors understand how much they are paying for each dollar of earnings and is often used as a measure of a company’s relative value in the market.
Key Terms:
- Market Price: The current trading price of a company’s stock. This price is determined by supply and demand in the stock market and reflects what investors are willing to pay for a share of the company.
- Earnings Per Share (EPS): A company’s total earnings divided by the number of outstanding shares. EPS is a key indicator of a company’s profitability and is used in the calculation of the P/E ratio.
- Trailing P/E: A type of P/E ratio that uses the earnings per share over the last 12 months. Trailing P/E is backward-looking and reflects the company’s past performance.
- Forward P/E: A type of P/E ratio that uses projected earnings for the next 12 months. Forward P/E is forward-looking and is based on analysts’ estimates of future earnings.
- Growth P/E: Also known as the PEG ratio (Price/Earnings to Growth), it adjusts the P/E ratio by the company’s earnings growth rate, providing a more comprehensive view of a stock’s valuation in relation to its growth prospects.
The P/E ratio is a valuable tool for investors because it provides a quick snapshot of how much the market is willing to pay for a company’s earnings. A high P/E ratio might indicate that investors expect higher growth in the future, while a low P/E ratio could suggest that the stock is undervalued or that the company is experiencing challenges. For instance, if a company has a P/E ratio of 20, it means that investors are willing to pay $20 for every $1 of earnings.
There are several ways to interpret the P/E ratio, depending on the context. For example, a high P/E ratio could mean that a company’s stock is overpriced, but it could also indicate strong future growth prospects that justify the higher price. Conversely, a low P/E ratio might suggest that the stock is undervalued, but it could also be a sign of underlying problems within the company that investors are wary of.
One of the key challenges in using the P/E ratio is that it does not account for differences in growth rates between companies. Two companies might have the same P/E ratio, but if one is growing much faster than the other, it might actually be undervalued relative to its future earnings potential. This is where the PEG ratio can be particularly useful, as it adjusts the P/E ratio based on the company’s earnings growth rate, providing a more nuanced view of valuation.
Another challenge with the P/E ratio is that it can be affected by non-recurring events, such as one-time gains or losses, which can distort earnings and, consequently, the P/E ratio. For this reason, some investors prefer to use normalized earnings, which exclude these non-recurring items, to get a clearer picture of a company’s ongoing profitability.
The P/E ratio also does not consider the company’s debt levels. A company with a high level of debt might have a lower P/E ratio because its earnings are reduced by interest payments, but this does not necessarily mean that the stock is undervalued. Therefore, it’s important for investors to consider the P/E ratio in conjunction with other financial metrics, such as the debt-to-equity ratio, to get a fuller understanding of a company’s financial health.
Furthermore, the P/E ratio should be interpreted relative to the industry average. Different industries have different typical P/E ratios, and comparing a company’s P/E ratio to its industry peers can provide additional insights into whether the stock is fairly valued. For example, technology companies often have higher P/E ratios due to their growth potential, while utility companies may have lower P/E ratios because of their stable but slower growth.
In conclusion, the Price-to-Earnings Ratio (P/E) is a fundamental tool in investment analysis, offering insights into how the market values a company’s earnings. While it is a simple and widely used metric, it should not be used in isolation. Investors should consider the P/E ratio alongside other financial indicators and in the context of the company’s industry, growth prospects, and overall financial health. By doing so, investors can make more informed decisions about whether a stock is a good buy based on its valuation.
« Back to Index